


Intent: research — An athletic awards database pg_stat_statements review is the practice of querying PostgreSQL’s pg_stat_statements extension to surface which SQL statements consume the most time, I/O, and memory across all queries running against a school’s athletic recognition database — identifying the specific hall of fame lookups, records board aggregations, and inductee search queries that slow down kiosk and display performance before they become noticeable to coaches, families, and student-athletes at recognition events.
This workflow is written for school IT administrators, database administrators, and athletic department data stewards who manage PostgreSQL-backed award archives that power digital hall of fame displays, lobby touchscreen kiosks, and championship records boards. It covers enabling and configuring pg_stat_statements, the full seven-step review workflow, a categorized priority table for ranking findings, the athletic-award-specific query patterns most likely to appear in the results, and a review calendar that aligns pg_stat_statements analysis cycles with the recognition program’s seasonal event schedule.
Performance problems in athletic recognition databases rarely announce themselves until they are already affecting recognition events. A hall of fame kiosk that loads slowly during an induction night, a records board that takes several seconds to render during a championship celebration, a search query that times out when families browse athlete profiles during a banquet — these experiences have a database explanation that pg_stat_statements is uniquely positioned to provide. The extension records statistics about every SQL statement executed against the database, and a structured athletic awards database pg_stat_statements review turns that accumulated data into a ranked list of the specific queries that deserve attention and the specific optimizations most likely to resolve them.

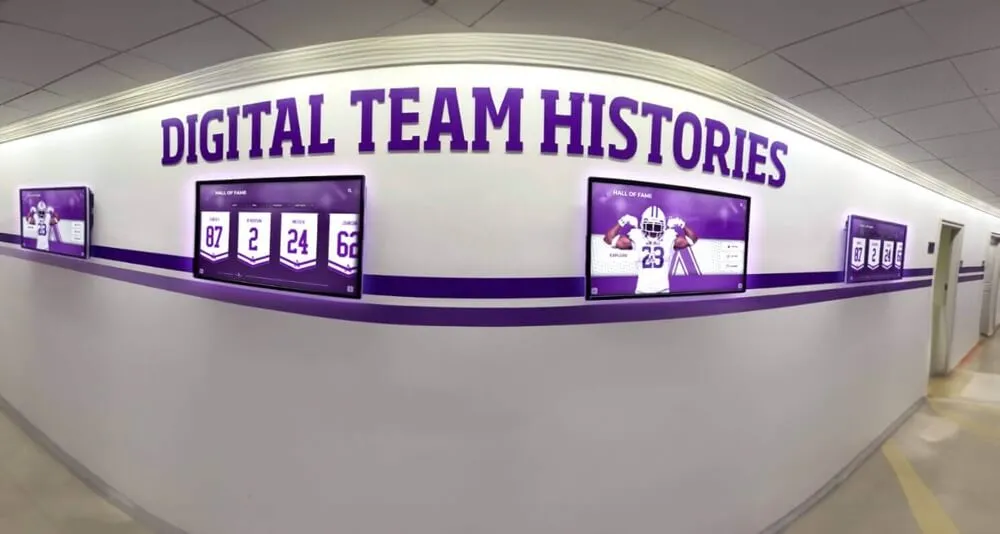
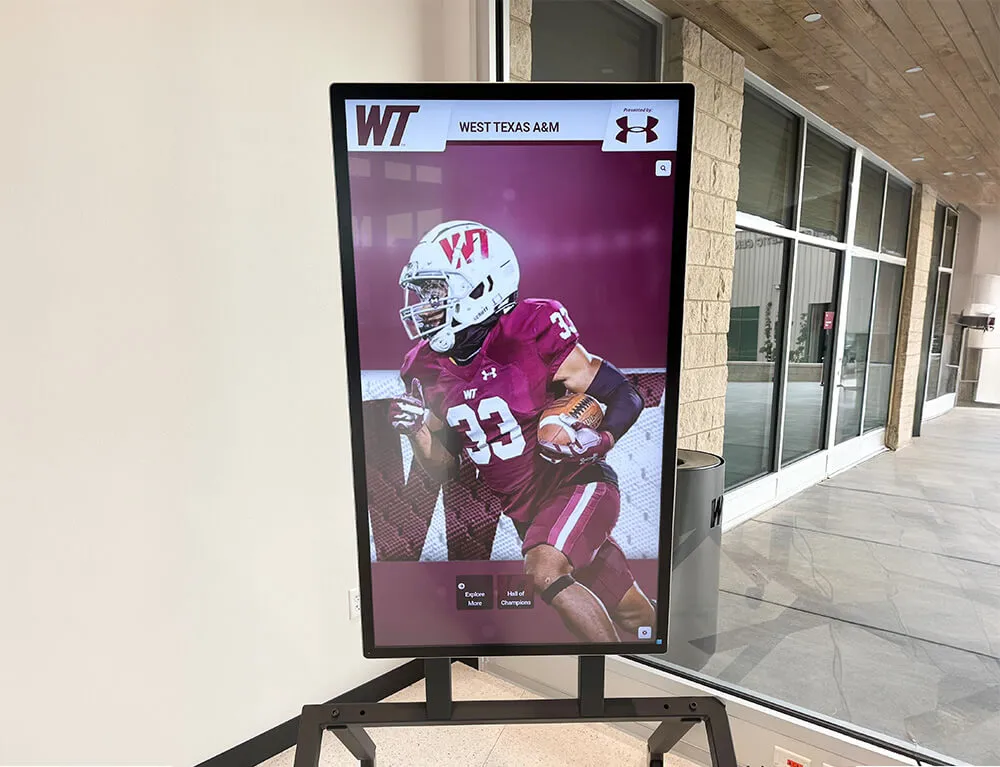
Hall of fame displays like this one execute dozens of database queries per session — pg_stat_statements accumulates execution statistics for every one of those queries across the entire recognition season, making it possible to rank them by total time, call frequency, and I/O impact
What Is pg_stat_statements and Why Does It Matter for Athletic Award Displays?
pg_stat_statements is a PostgreSQL extension that tracks execution statistics for every SQL statement run against a database. Once enabled, it populates a view of the same name where each row represents a distinct normalized query (with literal values replaced by parameter placeholders), and each row’s columns record how many times that query ran, how much total and mean time it consumed, how many rows it returned, how many disk blocks it read versus served from cache, and how much temporary disk space it used.
For an athletic award database serving real-time display queries, pg_stat_statements answers the questions that explain display latency:
- Which query runs most often? High-call-count queries are the most likely candidates for caching, connection pooling optimization, or result materialization.
- Which query consumes the most total execution time? Total time is the best signal for queries whose optimization will have the largest aggregate impact on database load.
- Which query has the highest mean execution time? High mean time on a query called during display rendering directly determines how long a user waits for a screen to load.
- Which query reads the most blocks from disk? High disk reads signal missing indexes, stale statistics, or queries that need partial index support to reduce scan scope.
- Which query writes to temporary files? Temporary file writes indicate that sort or hash operations exceed
work_mem, requiring memory configuration adjustment or query restructuring.
For athletic recognition programs evaluating how query review evidence supports long-term record reliability, athletic award data reconciliation reports cover the data quality process that runs parallel to query performance review — the two workflows share the same database tables and are most effective when scheduled together.
Enabling and Configuring pg_stat_statements in Your Award Database
pg_stat_statements is a shared-preload extension, which means it must be listed in postgresql.conf before PostgreSQL starts and requires a server restart to activate. These configuration steps are required once per database server; the extension is then available across all databases on that server.
Add the extension to shared_preload_libraries.
In postgresql.conf:
shared_preload_libraries = 'pg_stat_statements'
If other extensions are already listed, add pg_stat_statements to the comma-separated list rather than replacing existing entries.
Set the tracking scope and statement limit.
In postgresql.conf (shown with recommended values for recognition databases):
pg_stat_statements.track = all
pg_stat_statements.max = 10000
track_io_timing = on
Setting pg_stat_statements.track = all captures nested statements inside functions and procedures, which is relevant for award databases that use stored procedures for induction workflow transitions. Setting track_io_timing = on adds I/O timing data to each row, which is particularly useful for identifying display queries that spend most of their time waiting for disk reads rather than processing data.
Restart PostgreSQL and create the extension.
After restarting the server, run the following in the target database:
CREATE EXTENSION IF NOT EXISTS pg_stat_statements;
Verify the extension is active.
SELECT extname, extversion
FROM pg_extension
WHERE extname = 'pg_stat_statements';
A row returned confirms the extension is installed. If no row appears, verify shared_preload_libraries was set correctly before the server restart.
The Athletic Awards Database pg_stat_statements Review Workflow: Seven Steps
A structured athletic awards database pg_stat_statements review follows seven steps in sequence. Running queries against the view without the surrounding steps produces raw data without context; the workflow provides the context that converts raw data into prioritized action items.
Step 1: Establish a Clean Baseline
Before reviewing pg_stat_statements data, verify that the current statistics cover a representative sample of the database’s query workload — ideally at least one full recognition event cycle (a hall of fame query session, a post-ceremony data entry period, or a typical display traffic window).
If the statistics have been accumulating since an arbitrary point in the past and may include one-time imports or maintenance operations not representative of display traffic, reset the counters and let the system collect a fresh sample:
SELECT pg_stat_statements_reset();
After resetting, allow the system to accumulate statistics across a period that includes the query patterns you want to analyze — typically 24 to 72 hours of normal display traffic before reviewing results.
Step 2: Query Top Consumers by Total Execution Time
Total execution time is the primary ranking dimension. A query that runs 50,000 times per day and averages 2 ms per call contributes 100 seconds of total execution time. A query that runs 100 times per day and averages 800 ms per call contributes 80 seconds. Both are candidates for review, but the high-frequency query has a larger aggregate impact on database resources.
SELECT
  LEFT(query, 120)                          AS query_preview,
  calls,
  ROUND(total_exec_time::numeric, 0)        AS total_ms,
  ROUND(mean_exec_time::numeric, 2)         AS mean_ms,
  ROUND(stddev_exec_time::numeric, 2)       AS stddev_ms,
  rows
FROM pg_stat_statements
ORDER BY total_exec_time DESC
LIMIT 25;
Record the top 10 rows as the starting candidate list for your review.
Step 3: Query High-Mean Statements with Meaningful Call Counts
High mean execution time on a query called during recognition display rendering has a direct relationship with user-visible latency: every millisecond of mean execution time adds a millisecond to the time a family member waits for an inductee profile to load. Filter to queries with at least 10 calls to exclude one-time administrative operations:
SELECT
  LEFT(query, 120)                          AS query_preview,
  calls,
  ROUND(mean_exec_time::numeric, 2)         AS mean_ms,
  ROUND(stddev_exec_time::numeric, 2)       AS stddev_ms,
  ROUND(total_exec_time::numeric, 0)        AS total_ms
FROM pg_stat_statements
WHERE calls >= 10
ORDER BY mean_exec_time DESC
LIMIT 25;
The stddev_exec_time column is particularly informative: a high standard deviation relative to mean indicates that the query’s performance varies significantly across executions — often a sign of plan instability, cache pressure, or lock contention during concurrent import windows.
Step 4: Identify I/O-Intensive Queries
Queries that read many blocks from disk rather than serving them from the shared buffer cache are the most likely beneficiaries of index additions or partial index creation. The cache hit percentage converts raw block counts into an interpretable signal:
SELECT
  LEFT(query, 120)                                        AS query_preview,
  calls,
  shared_blks_hit,
  shared_blks_read,
  ROUND(
    shared_blks_hit::numeric /
    NULLIF(shared_blks_hit + shared_blks_read, 0) * 100,
  1)                                                      AS cache_hit_pct,
  ROUND(blk_read_time::numeric, 1)                        AS disk_read_ms
FROM pg_stat_statements
WHERE shared_blks_read > 0
ORDER BY shared_blks_read DESC
LIMIT 20;
A cache hit percentage below 90% on a frequently called display query signals that the query is not benefiting from shared buffer caching — either because the relevant table is too large to stay cached, because the query accesses too many pages, or because an index that would narrow the scan does not exist.
Step 5: Flag Queries Writing to Temporary Files
Temporary file writes are a sign of in-memory sort or hash operations that exceed PostgreSQL’s work_mem setting. For display queries that sort inductees by year, filter athletes by sport, or aggregate season statistics, temporary writes add variable latency that cannot be eliminated by index tuning alone:
SELECT
  LEFT(query, 120)                          AS query_preview,
  calls,
  temp_blks_written,
  ROUND(mean_exec_time::numeric, 2)         AS mean_ms
FROM pg_stat_statements
WHERE temp_blks_written > 0
ORDER BY temp_blks_written DESC
LIMIT 15;
Any display-serving query writing to temporary files is a candidate for work_mem adjustment, query rewrite, or materialized view pre-aggregation to eliminate the sort or hash step at query time.
Step 6: Categorize All Findings Against the Priority Table
Collect the rows identified in Steps 2 through 5 into a unified candidate list. Apply the priority table in the following section to assign each finding a remediation category and priority level. This step converts the raw query list into an ordered work plan.
Step 7: Apply Optimizations, Verify, and Document
For each prioritized finding, apply the appropriate remediation (detailed in the optimization section below), then re-run the Step 2 and Step 3 queries to verify that total execution time and mean execution time have decreased for the optimized query. Document the initial metric, the change applied, and the resulting metric in the database’s maintenance log. Schedule the next review using the recognition calendar alignment guidance at the end of this guide.
Priority Table: Categorizing pg_stat_statements Findings for Athletic Award Databases
Use this table to assign each candidate query from the review a category and priority level based on its pg_stat_statements profile. Apply remediations in priority order — P1 first, then P2, then P3 — to concentrate optimization effort where it produces the largest improvement in display query responsiveness.
| Category | Signal | Priority | Likely Cause | Primary Remediation |
|---|---|---|---|---|
| High-frequency display query | calls > 1,000/day, mean_ms > 50 | P1 | Missing index on filter or join column | Add targeted index; consider covering index |
| Slow inductee profile load | mean_ms > 500, calls > 10 | P1 | Sequential scan on large award table | Add partial index on active/published records |
| High-disk-read display query | cache_hit_pct < 80%, calls > 50 | P1 | Table too large for buffer, missing index | Index creation; increase shared_buffers |
| Temp-file-writing sort query | temp_blks_written > 100, calls > 20 | P2 | work_mem insufficient for ORDER BY sort | Increase work_mem per role; or create materialized view |
| Aggregate records board query | total_ms > 10,000, mean_ms > 200 | P2 | Full table scan for aggregation | Add partial index; consider materialized summary |
| High-stddev display query | stddev_ms > 3× mean_ms | P2 | Plan instability or lock contention | Run ANALYZE; investigate lock waits |
| One-time import query | calls = 1–5, total_ms > 5,000 | P3 | Bulk insert or unindexed import | Acceptable; document, do not optimize display path |
| Maintenance query (VACUUM, ANALYZE) | any | P3 | Normal autovacuum or manual maintenance | Confirm autovacuum is not scheduled during peak display events |
The P3 category is important: import and maintenance queries frequently appear at the top of total execution time rankings because they run infrequently but for long durations. Distinguishing maintenance queries from display-path queries ensures optimization effort targets the statements that actually affect recognition event experiences.
For programs managing a digital hall of fame with complex inductee categories across athletics, academics, and donor recognition, selecting the right hall of fame tools for athletics, donors, and arts programs covers the platform selection factors — including backend query architecture — that determine how much pg_stat_statements work is required on a self-hosted versus fully managed recognition system.
Key Athletic Award Query Patterns to Monitor
Athletic award databases have query patterns that differ from general-purpose databases because the display workload is read-heavy, event-concentrated, and structured around relationships between athletes, sports, seasons, and award categories. The following patterns appear most consistently in pg_stat_statements results for recognition databases.
Inductee browse queries. Queries that retrieve a paginated list of hall of fame inductees filtered by sport, graduation year, or award category are the most common high-call-count query in a well-trafficked digital recognition system. These queries typically join the athlete, induction, and sport tables, filter on an indexed status column (published, active), and sort by a display-order field. Missing an index on the sport_id or induction_year filter columns forces a sequential scan even when the WHERE clause is highly selective.
Records board aggregation queries. Queries that calculate school records — the fastest time, the most career points, the highest batting average — are aggregation queries that GROUP BY sport and award category while filtering for record-type entries. These queries run less frequently than browse queries but have higher mean execution times because they process more rows. A partial index limited to record-type entries can dramatically reduce the scan scope for these queries without adding index maintenance overhead to the full award table.
Search and autocomplete queries. Recognition platforms that offer name search functionality execute LIKE or full-text search queries against athlete name fields with each keystroke or form submission. These queries are extremely high-frequency during busy display sessions and perform poorly when the LIKE pattern begins with a wildcard. If search is a key display feature, a pg_trgm index on the name column enables index-supported ILIKE queries and eliminates the full sequential scan.
QR code profile resolution queries. When a kiosk offers QR code mobile unlocks — where families scan a code to view an athlete’s full profile on their phone — the resulting query must resolve an athlete identifier to a full profile record quickly, because mobile users have lower tolerance for load latency than kiosk users. These queries are typically point lookups by primary key or unique token, and they should always return in single-digit milliseconds. If they appear in pg_stat_statements with elevated mean times, the cause is usually table bloat or connection overhead rather than a query structure problem.
For hall of fame programs managing basketball recognition archives that include deep historical records across multiple decades, what a complete basketball hall of fame display program covers describes the inductee categories and record types whose underlying queries most commonly appear in pg_stat_statements review candidates for school athletic databases.
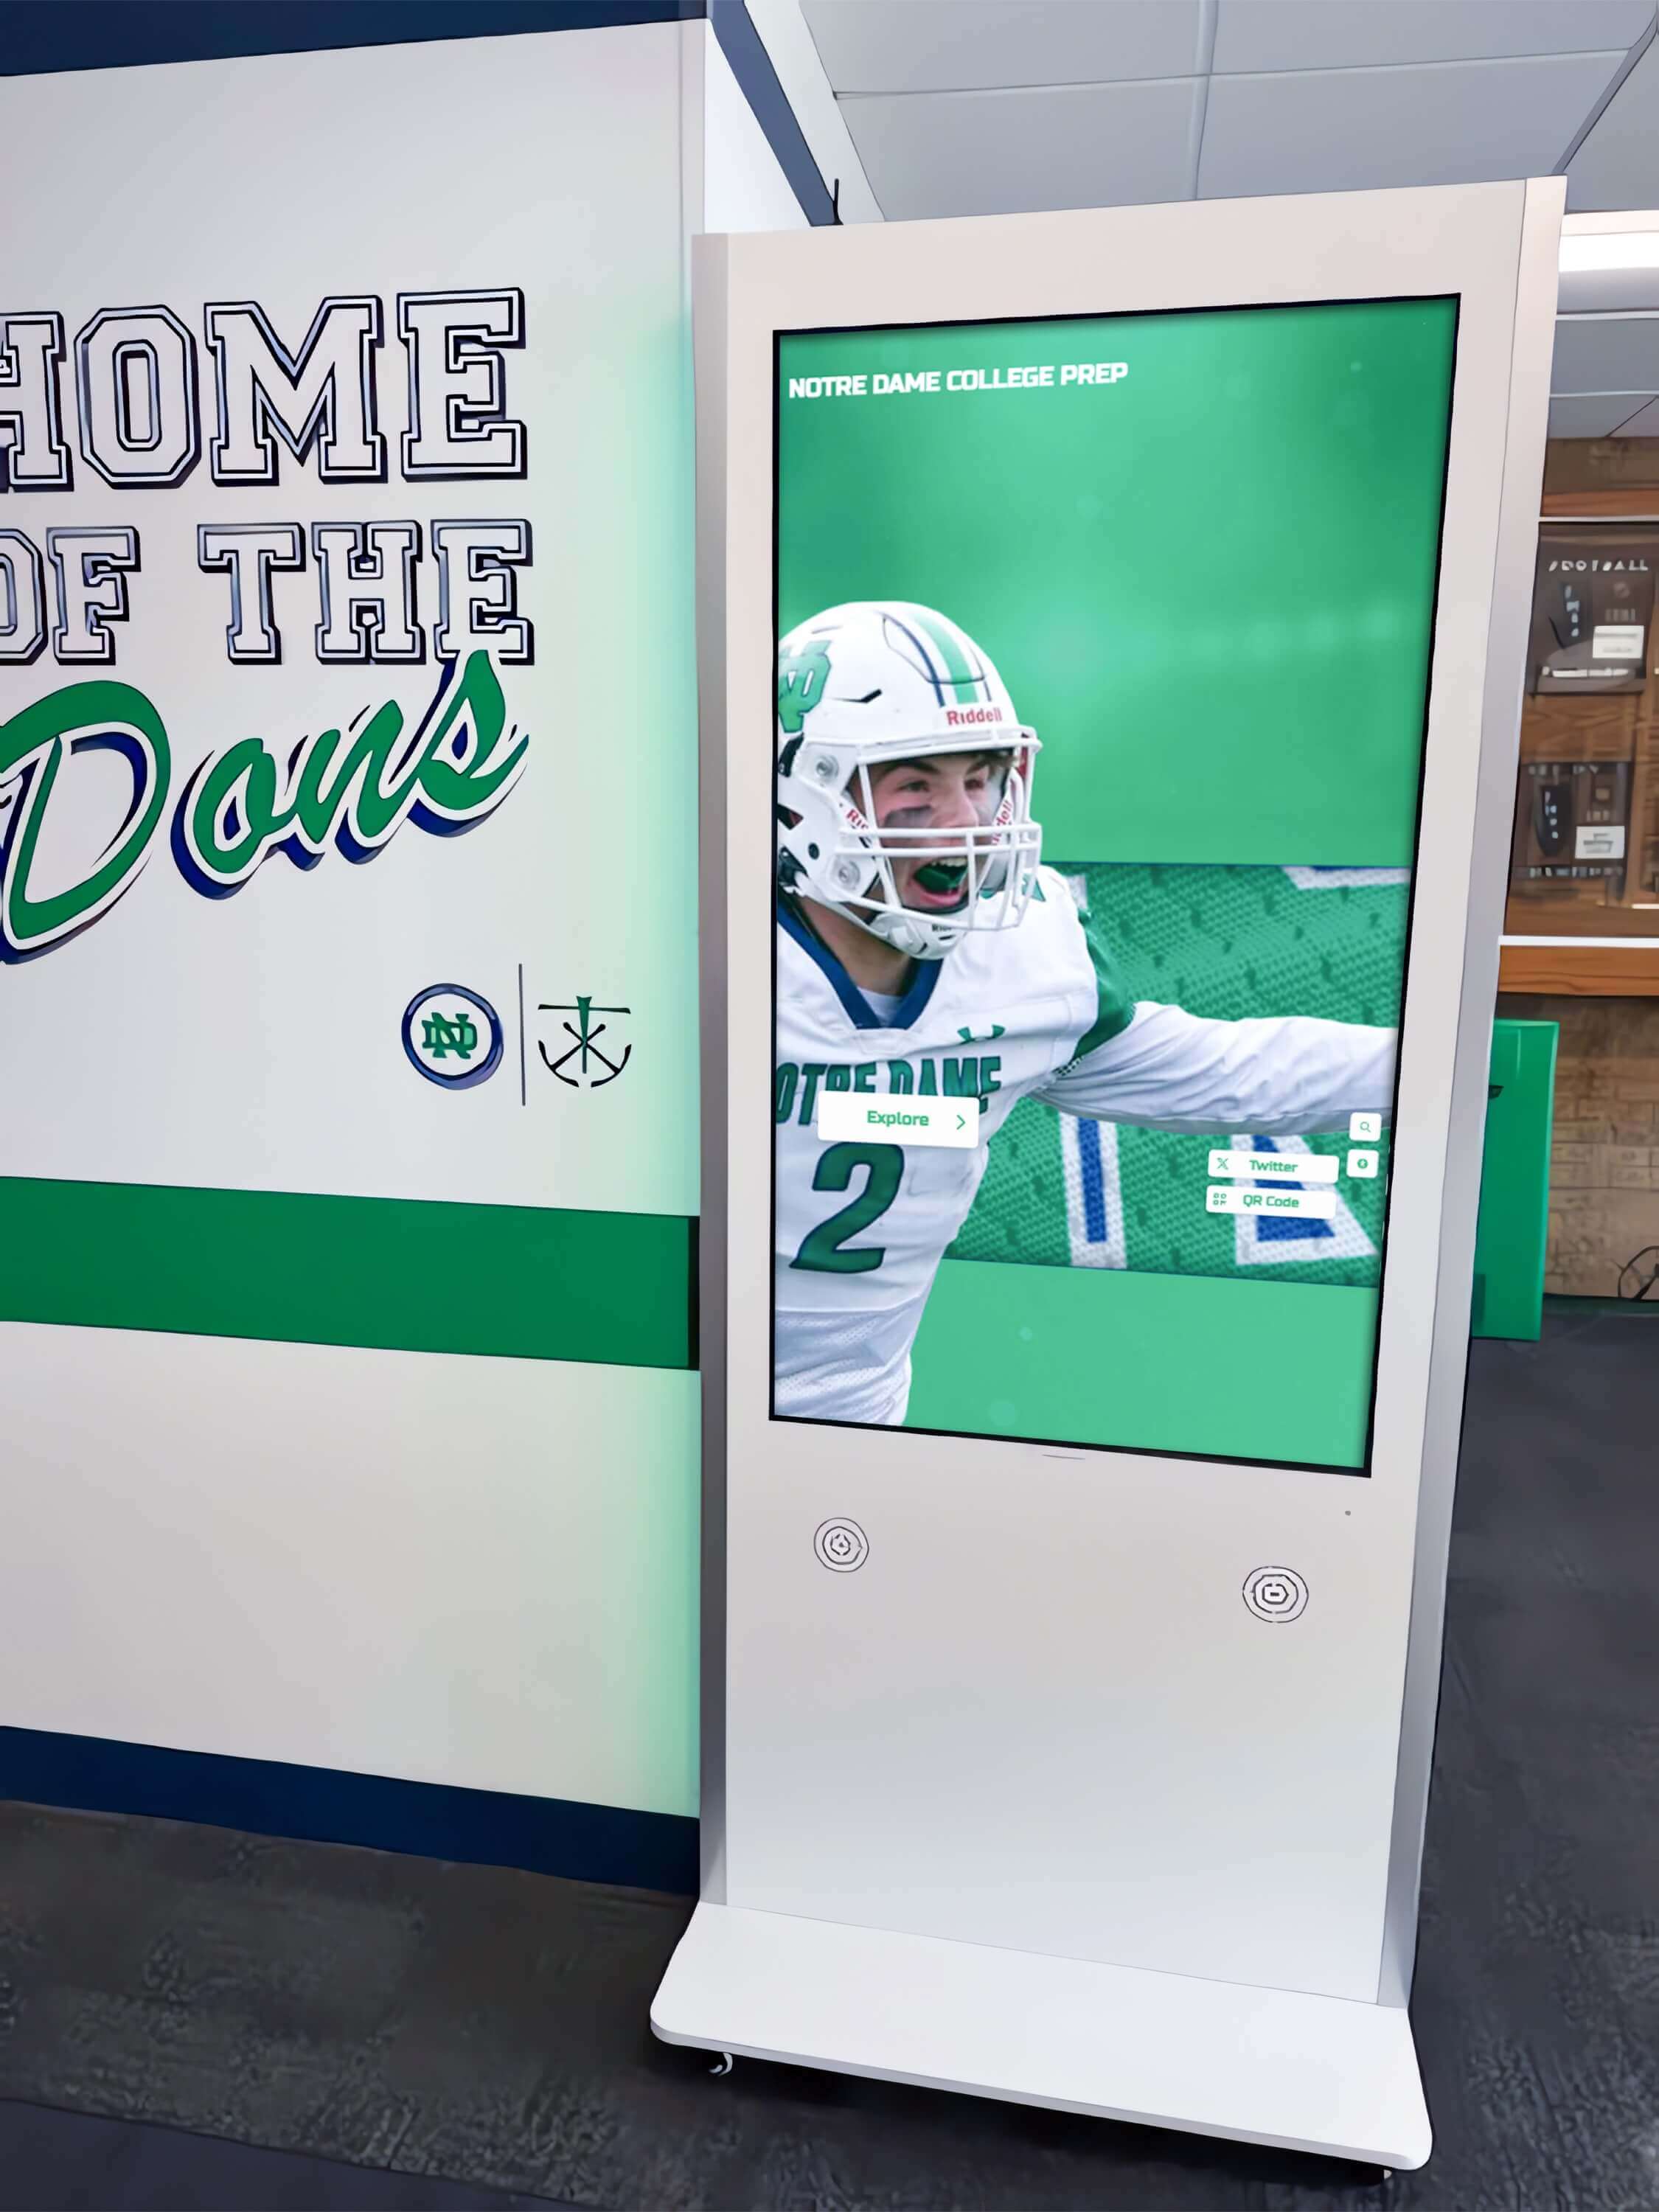
Hallway kiosks like this execute dozens of database queries per visitor session — pg_stat_statements accumulates their combined execution statistics, making seasonal review cycles the most effective way to identify which query patterns have grown problematic as the recognition archive expands
Acting on Findings: Optimization Paths for Common Award Database Queries
Once candidates are categorized using the priority table, each category has a well-defined set of remediation paths. Work through P1 findings first; re-run baseline queries after each change to confirm the change had the intended effect before moving to the next finding.
Adding a targeted index for high-frequency browse queries.
CREATE INDEX CONCURRENTLY idx_inductees_sport_year
ON athletic_inductees (sport_id, induction_year)
WHERE status = 'published';
Using CONCURRENTLY avoids locking the table during index creation, which is critical for production databases serving active display queries. The partial index (WHERE status = 'published') limits the index to rows that appear in browse query results, keeping index size small and scan performance high.
Increasing work_mem for sort-heavy display queries.
Rather than changing work_mem globally, set it for the specific connection role that serves display queries:
ALTER ROLE display_reader SET work_mem = '32MB';
Test with EXPLAIN (ANALYZE, BUFFERS) on the identified query to confirm that the sort now operates in memory rather than spilling to disk before deploying the change to production.
Creating a materialized view for records board aggregation.
CREATE MATERIALIZED VIEW athletic_records_board AS
SELECT
  sport_id,
  award_category,
  athlete_id,
  record_value,
  season_year
FROM athletic_awards
WHERE award_type = 'school_record'
ORDER BY sport_id, award_category;
Refresh the view after major import cycles:
REFRESH MATERIALIZED VIEW CONCURRENTLY athletic_records_board;
A materialized view pre-computes the aggregation results and serves them from a dedicated table that has its own indexes. The records board display query then reads from the view rather than scanning the full award table, eliminating the aggregation step from every display request.
See How a Managed Recognition Platform Handles Query Performance for You
Rocket Alumni Solutions provides school athletic directors and IT administrators with a cloud-based recognition platform where display query optimization, index management, and database maintenance are handled at the infrastructure level — so the hall of fame kiosks, records boards, and inductee displays your program depends on stay responsive throughout the recognition season without requiring your team to run pg_stat_statements reviews or tune database settings manually. Request a demo to see how the platform keeps recognition records fast at scale.
Request a Platform DemoScheduling pg_stat_statements Reviews on the Athletic Recognition Calendar
Athletic recognition databases have a predictable activity calendar that determines when pg_stat_statements review data is most useful and when review cycles should be scheduled. Aligning review timing with the recognition calendar ensures that query statistics reflect the workload patterns most relevant to optimizing display performance.
Pre-season review (4–6 weeks before the first major recognition event). Reset pg_stat_statements at the start of the review window, allow 1–2 weeks of accumulated data covering pre-season administrative queries (data entry, athlete profile creation, award category setup), then run the full seven-step review. Changes made at this point have the maximum runway before peak display traffic arrives at end-of-season ceremonies.
Post-ceremony review (within 2 weeks after a major recognition event). End-of-season ceremonies, hall of fame induction nights, and banquet events generate the highest display query traffic in a recognition program’s calendar. Running a pg_stat_statements review immediately after one of these events captures the exact query patterns — browse queries, profile loads, search queries, QR code resolutions — that real recognition event traffic produces. This is the most representative sample for identifying which queries need optimization before the next ceremony.
Historical import review (following each bulk historical data import). When a program adds historical award records in bulk — digitizing trophy case records from prior decades, importing records from a retired system, or adding a backfill of past inductees — the import operation appears prominently in pg_stat_statements as high-total-time, low-call-count queries. Run a review after the import completes to confirm that the import queries did not degrade indexes or autovacuum thresholds, and to verify that new display queries serving the expanded record set are performing as expected.
For programs coordinating their recognition display infrastructure with broader school network configuration — where display devices connect to the award database through school network architecture — school recognition display HDMI-CEC configuration guides cover the display-side configuration context that determines how many concurrent display sessions generate simultaneous database queries during recognition events.
For programs considering how alumni management features connect to the award database query layer — where the same database tables serve both athletic records displays and alumni engagement functions — alumni management software feature comparisons for schools covers the platform capabilities that determine the scope and complexity of the query workload that pg_stat_statements will log.
pg_stat_statements and Display Accessibility Performance
Query review evidence connects directly to display accessibility performance. A hall of fame platform that meets WCAG 2.1 AA standards at the presentation layer but has slow database queries serving its content fails the experience for users who depend on assistive technology — screen reader navigation of a slow-loading inductee list is a materially worse experience than the same navigation on a fast-loading page. Display query performance is part of accessibility assurance for school recognition programs.
For programs conducting full digital hall of fame audits that include both presentation-layer standards (text spacing, contrast, focus order) and backend performance, digital hall of fame WCAG text spacing audit guides cover the accessibility review process whose success depends on database queries returning within the response time thresholds that assistive technology users require.
For school programs planning athletic recognition events where display performance directly affects the experience of athletes, families, and staff — from banquets to senior nights — basketball senior night celebration and recognition program ideas illustrates the recognition event context where digital display responsiveness is most visible and where pg_stat_statements review findings translate directly into the athlete experience.
Frequently Asked Questions
What is pg_stat_statements and how does it help with athletic award database performance?
pg_stat_statements is a PostgreSQL extension that records execution statistics for every SQL statement run against a database. For athletic award databases, it logs data for hall of fame browse queries, inductee profile loads, records board aggregations, and search queries — capturing how often each runs, how long each takes on average and in total, how many disk blocks each reads, and how much temporary space each uses. A structured review of pg_stat_statements data produces a ranked list of the specific queries responsible for display latency, making it possible to target index creation, work_mem configuration, and query rewrites at the statements that will produce the largest improvement in recognition event display performance.
How do I reset pg_stat_statements to start a clean review cycle?
Call SELECT pg_stat_statements_reset(); to clear all accumulated statistics and start a fresh collection window. After resetting, allow the database to accumulate statistics across a representative sample of its display traffic — typically 24 to 72 hours of normal recognition system activity, or a full recognition event session — before running the review queries. Resetting is particularly useful when prior statistics include one-time import operations or maintenance windows that are not representative of the ongoing display query workload. Superuser or pg_read_all_stats role membership is required to call the reset function.
What does a high stddev_exec_time value mean for a recognition display query?
A high standard deviation relative to mean execution time — for example, a mean of 80 ms with a standard deviation of 200 ms — means the query's performance varies widely across executions. For recognition display queries, high variability usually signals one of three causes: query plan instability (the planner is choosing different plans on different executions, often because statistics are stale), lock contention (some executions wait for a lock held by a concurrent import or correction operation), or cache pressure (the query sometimes finds its data in the shared buffer cache and sometimes must read from disk). Run EXPLAIN (ANALYZE, BUFFERS) on the query during a slow execution and a fast execution to compare plans and buffer hit rates, then address the root cause identified.
How often should a school athletic database run a pg_stat_statements review?
A minimum schedule of three reviews per year aligns with the recognition calendar: one pre-season review 4–6 weeks before the first major recognition event, one post-ceremony review within two weeks of the end-of-season hall of fame event or awards banquet, and one post-import review after the annual historical records digitization or system migration cycle. Programs that add new display features, expand the recognition archive significantly, or observe any increase in display load times should trigger an unscheduled review immediately rather than waiting for the next calendar window. The review is non-disruptive — reading pg_stat_statements requires no locks and no downtime.
Does enabling pg_stat_statements affect the performance of the athletic award database?
Enabling pg_stat_statements adds a small overhead to every query execution — typically under 1% for most workloads — because the extension must hash each normalized query, look it up in its tracking hash table, and update its statistics counters. For the vast majority of school athletic recognition databases, this overhead is negligible relative to the optimization gains that regular pg_stat_statements reviews produce. The most significant configuration overhead comes from setting track_io_timing = on, which adds I/O timing measurements via OS-level clock calls; on Linux systems this adds approximately 50–100 nanoseconds per I/O operation and is generally worth enabling for the diagnostic detail it provides. If overhead becomes a concern on a heavily loaded system, set pg_stat_statements.track = top to track only top-level statements and exclude nested calls.
Conclusion: A Repeatable pg_stat_statements Review for Healthier Recognition Displays
An athletic awards database pg_stat_statements review workflow converts the extension’s accumulated query statistics into a prioritized action list for maintaining recognition display performance across the full recognition calendar. The seven-step workflow — baseline reset, total-time query, mean-time query, I/O intensity query, temporary-file query, priority categorization, and verified optimization — provides a repeatable structure that produces consistent results whether it is run before a fall hall of fame night, after a spring athletic banquet, or following a summer historical records import.
Programs that run scheduled pg_stat_statements reviews maintain recognition displays that load quickly during the events that matter most: the induction nights, banquet evenings, and championship celebrations where athletes and families are actively engaging with digital recognition kiosks and looking up records boards. Programs that skip query review until performance problems become visible are diagnosing under pressure — during or after the event where the problem first appeared.
A repeatable pg_stat_statements review practice, documented in the athletic department’s database maintenance calendar and tied to the recognition event schedule, is the most direct path from a reactive performance culture to one where display speed is a confirmed, verified property of the recognition program’s infrastructure rather than an open question before every major event.
Keep Recognition Display Queries Fast Without Managing the Database Yourself
Rocket Alumni Solutions provides school athletic directors and IT administrators with a cloud-based recognition platform where query performance, index management, and seasonal maintenance cycles are managed at the infrastructure level — so your hall of fame kiosks, records boards, and inductee displays stay responsive through every recognition event without your team running pg_stat_statements reviews or database tuning cycles. Request a demo to see how the platform delivers fast, reliable award display performance for schools of every size.
Request a Demo