



An athletic awards database pg_stat_user_functions review is the practice of querying PostgreSQL’s pg_stat_user_functions statistics view to measure how much execution time user-defined functions consume across a school’s award-import and data-reconciliation workflows — and, critically, to separate each function’s own execution time from the time it spends waiting on other functions it calls. The distinction between total_time and self_time is the core diagnostic value the view provides: total_time includes all time spent inside a function and every function it calls in turn, while self_time excludes the time attributed to nested calls, leaving only the function’s own work. Summing total_time across a stack of nested import functions counts the same elapsed time multiple times and produces numbers that cannot be acted on. Reading self_time for each function in a call chain gives a meaningful breakdown of where processing time actually accumulates. This guide is written for school IT administrators and database administrators managing a self-managed PostgreSQL 18 instance that backs a digital athletic recognition system. It covers the track_functions configuration parameter and its three values, the view’s column definitions, stable identity fields, the absence of a per-view reset timestamp column, the discipline of short controlled measurement windows, and how this monitoring workflow differs from a pg_stat_statements slow-query review.
Athletic recognition programs increasingly depend on custom database functions to move award data from source files into the PostgreSQL tables that power hall of fame kiosks, records boards, and touchscreen display systems. When those import functions run slowly — or when a data-reconciliation function consumes unexpected time during a live event — pg_stat_user_functions provides a function-level measurement surface that pg_stat_statements alone cannot. pg_stat_statements records time by normalized SQL statement text; it does not naturally decompose time spent inside a function body that wraps multiple sub-queries or calls sibling functions. pg_stat_user_functions fills that gap, but only after track_functions is set to an appropriate value, and only if the function in question has not been inlined out of the execution plan.

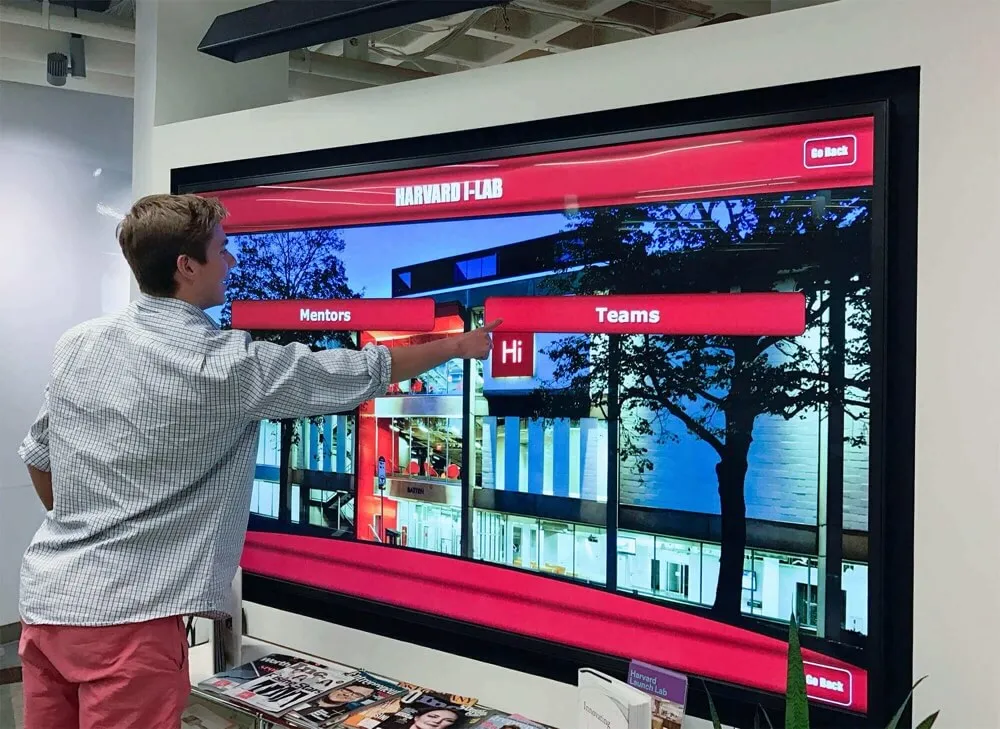
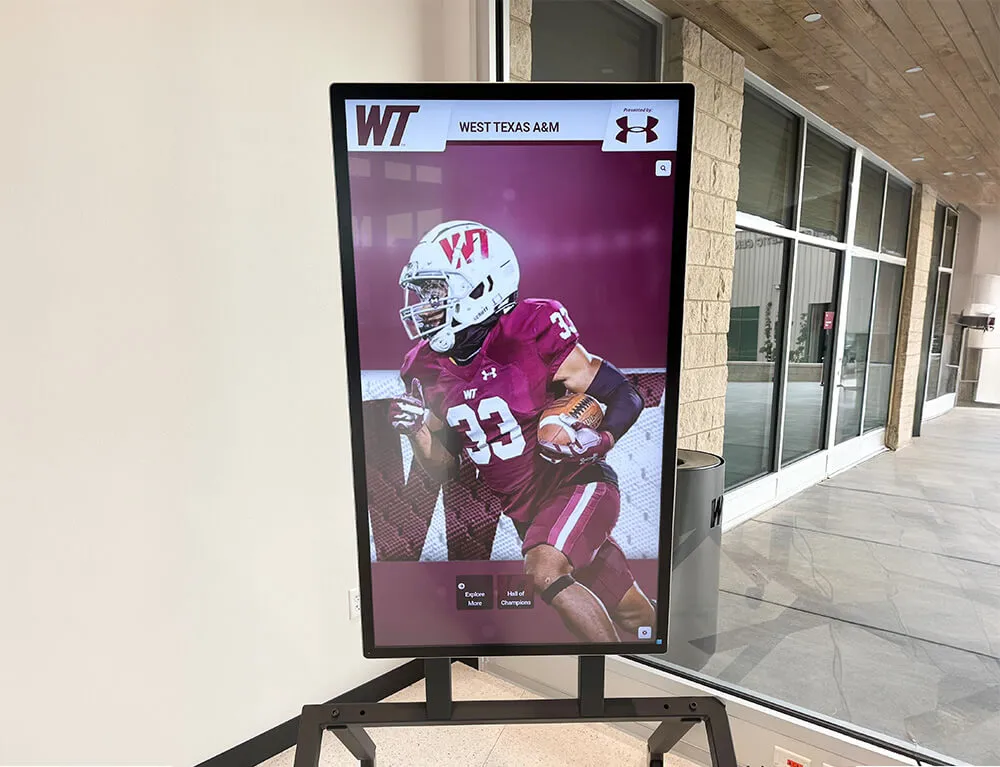
Recognition kiosks like this one depend on accurate, timely award imports — pg_stat_user_functions measures the execution time of the custom functions that perform those imports, breaking out each function's own work from the nested calls it delegates
What pg_stat_user_functions Tracks
pg_stat_user_functions is one of the cumulative statistics views provided by PostgreSQL’s statistics subsystem. According to the PostgreSQL 18 monitoring statistics documentation, the view contains one row for each tracked function, showing statistics about executions of that function. The view accumulates data across all sessions as long as statistics collection remains active.
The view covers user-defined functions — functions created with CREATE FUNCTION in a user database. It does not report on system-internal functions or on SQL operations executed outside a function context. For an athletic awards database, the functions most likely to appear here include:
- Award import functions that read from staging tables, validate award eligibility, and insert records into the main award table
- Data-reconciliation functions that compare award records against a reference source
- Record-board computation functions that recalculate standings after each season’s results are loaded
- Inductee-profile transformation functions that normalize name, sport, and year fields before display publication
A companion view, pg_stat_xact_user_functions, reports the same measurements but only for calls made within the current transaction — those values are not yet reflected in pg_stat_user_functions for the running transaction. Administrators reviewing cumulative historical data should read pg_stat_user_functions; those who want to observe a single in-progress transaction should read pg_stat_xact_user_functions.
Enabling Function Tracking: The track_functions GUC
Function statistics collection in PostgreSQL is controlled by the track_functions configuration parameter. According to the PostgreSQL 18 runtime configuration statistics documentation, track_functions accepts three values:
| Value | Functions tracked |
|---|---|
none | No function tracking (default) |
pl | Procedural-language functions only (PL/pgSQL, PL/Python, PL/Perl, etc.) |
all | Procedural-language functions, SQL-language functions, and C-language functions |
The default is none, which means pg_stat_user_functions contains no rows unless track_functions has been explicitly set. For a school IT environment where the award-import pipeline uses PL/pgSQL functions, setting track_functions = pl in postgresql.conf is sufficient and limits tracking overhead to procedural functions. Setting track_functions = all adds SQL and C functions to the tracked set.
Critical limitation: SQL-language functions that are simple enough to be inlined into the calling query will not be tracked, regardless of the track_functions setting. PostgreSQL’s query planner can replace a call to a simple SQL function with the function’s body directly in the execution plan — an optimization that eliminates a function call boundary at the cost of making the function invisible to function-level statistics collection. If an import helper function is absent from pg_stat_user_functions even after setting track_functions = all, inlining is the most likely explanation. Restructuring the function to prevent inlining — for example, by using a procedural language instead of plain SQL — will make it trackable, though that trade-off should be evaluated for each specific case.
Configuration change procedure: Set track_functions in postgresql.conf or via ALTER SYSTEM:
ALTER SYSTEM SET track_functions = 'pl';
SELECT pg_reload_conf();
pg_reload_conf() makes the new value active without a full server restart. Verify the active value:
SHOW track_functions;
Do not enable tracking globally without first reviewing the overhead implications for the specific server load profile. Any postgresql.conf modification should go through the same authorization and documentation process as any other configuration change to the production PostgreSQL 18 instance.
The View Columns: Definitions and Types
The pg_stat_user_functions view provides six columns. Each row uniquely identifies a tracked function and reports its accumulated execution statistics since the last statistics reset.
| Column | Type | Description |
|---|---|---|
funcid | oid | OID of the function — a stable numeric identifier assigned at function creation |
schemaname | name | Name of the schema containing the function |
funcname | name | Name of the function |
calls | bigint | Number of times this function has been called since statistics were last reset |
total_time | double precision | Total time spent in this function and all functions called by it, in milliseconds |
self_time | double precision | Total time spent in this function itself, not including time in other functions it called, in milliseconds |
All time values are reported in milliseconds. There is no per-execution or per-call time column in the view itself — mean execution time must be derived by dividing total_time or self_time by calls.
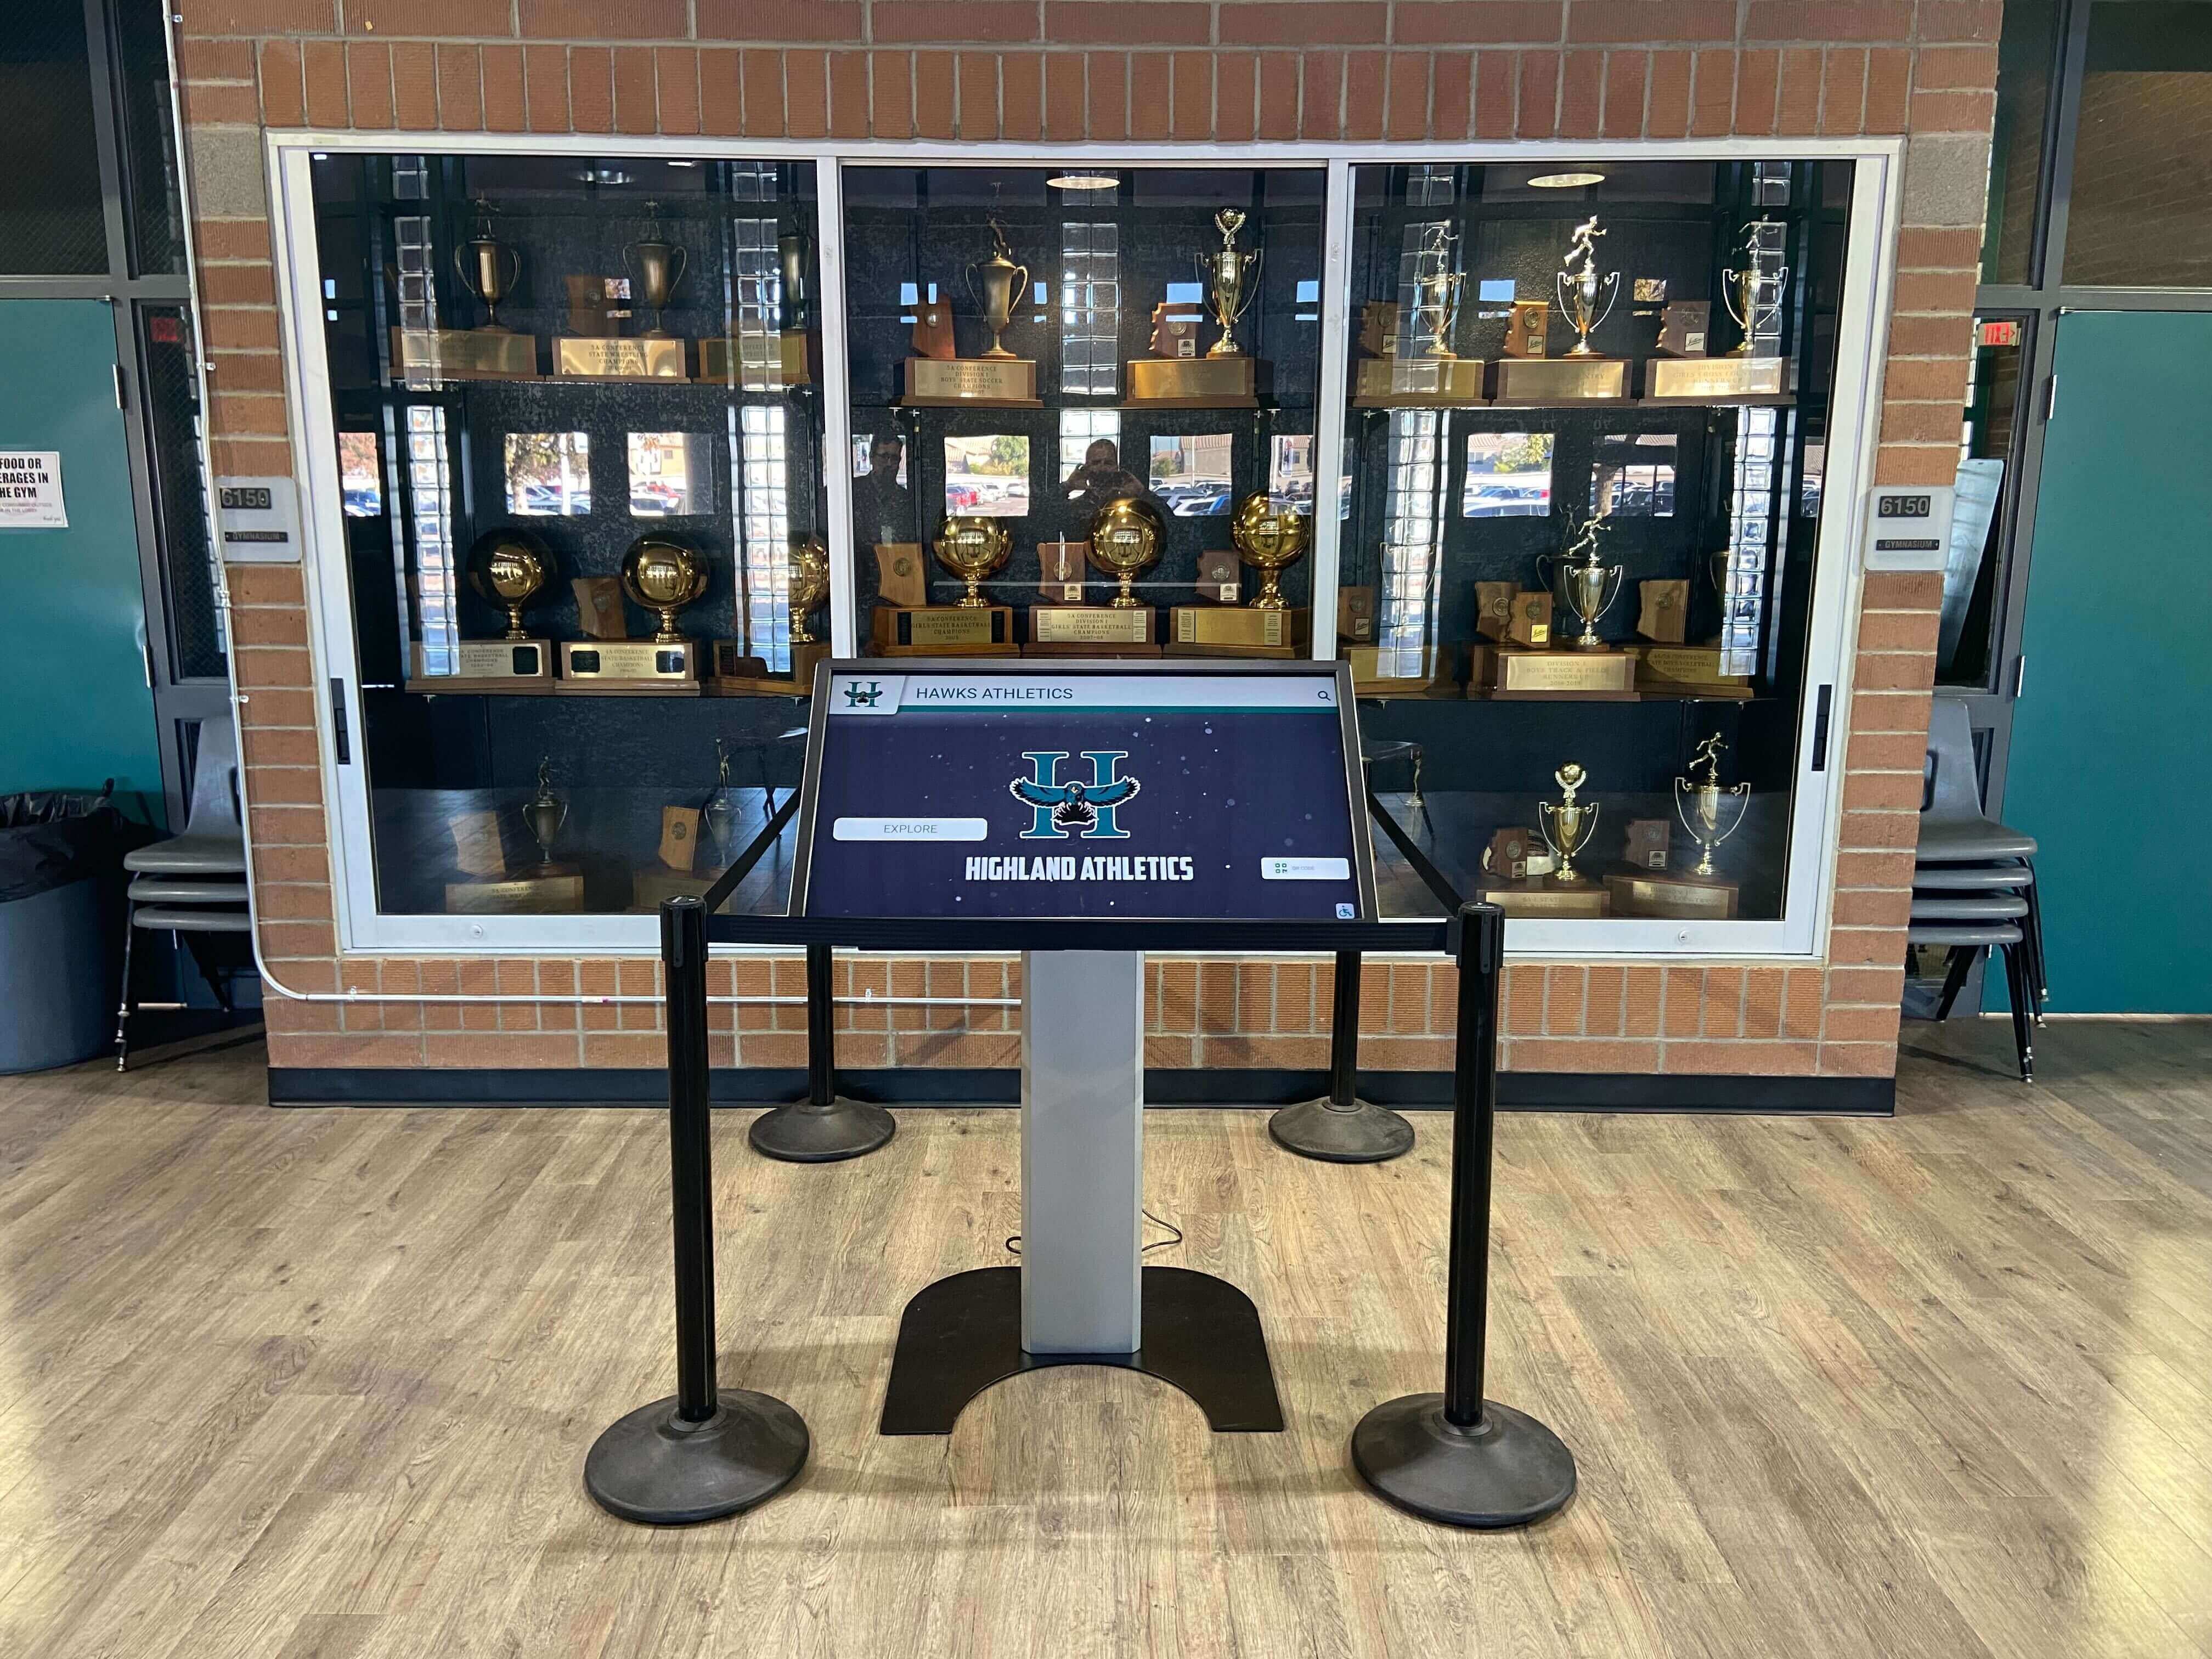
Athletic records displays depend on import functions running accurately and within acceptable time windows — pg_stat_user_functions provides per-function execution measurements with self_time isolating each function's own contribution from nested call overhead
The Self-Time and Total-Time Distinction: Why It Matters
The self_time and total_time columns answer different questions, and conflating them is the most common analytical error when reviewing function statistics.
total_time answers: How much time elapsed, in aggregate across all calls to this function, counting everything that happened inside it — including all nested function calls?
self_time answers: How much of that elapsed time belongs to this function’s own instructions, after subtracting the time its nested calls consumed?
Consider an illustrative arrangement for a recognition database with three functions — example names only, not production measurements:
import_award_batch()callsvalidate_athlete_eligibility()andinsert_award_record()for each row in a staging batchvalidate_athlete_eligibility()queries the athlete table and returns a booleaninsert_award_record()writes one record to the award table
After a batch completes, a query against the view might look like this:
SELECT
  funcname,
  calls,
  total_time,
  self_time,
  ROUND((self_time / NULLIF(calls, 0))::numeric, 3) AS mean_self_ms
FROM pg_stat_user_functions
WHERE schemaname = 'awards'
ORDER BY self_time DESC;
In such an arrangement, import_award_batch would show a large total_time because it includes all the time spent inside both child functions across every row in the batch. Its self_time would be much smaller — reflecting only the loop logic, parameter passing, and batch coordination the outer function performs directly. The child functions would each show total_time values close to their self_time values, because they do not in turn call other tracked functions.
The rule that prevents double-counting: Do not sum total_time across all functions in a nested call chain to arrive at a “total processing time” figure. If import_award_batch calls validate_athlete_eligibility ten times per batch, the time spent in validate_athlete_eligibility is already included in import_award_batch’s total_time. Adding both total_time values together counts validate_athlete_eligibility’s execution time twice.
The correct approach is to read self_time for each function to understand where time is genuinely accumulating. The function with the largest self_time relative to its calls is the one doing the most work per invocation — and often the most productive target for further investigation. A function with a large total_time but a small self_time is primarily a coordinator; the actual cost is in its callees.
Stable Identity: Using funcid, Schema, and Signature
Functions in PostgreSQL are identified by their OID (funcid), their schema, their name, and their argument signature. For analysis that spans multiple sessions or follows a function redefinition, using funcid alone can be unreliable — a DROP FUNCTION followed by CREATE FUNCTION assigns a new OID even for an identical signature, silently breaking any OID-based tracking reference.
The most durable identity for a monitored function combines:
schemaname— the schema it lives infuncname— the function name- The argument signature — which disambiguates overloaded functions sharing the same name in the same schema
For functions that have not been dropped and recreated, funcid provides an exact, session-independent match. A query that supports both identity modes:
SELECT
  funcid,
  schemaname,
  funcname,
  calls,
  total_time,
  self_time,
  ROUND((total_time / NULLIF(calls, 0))::numeric, 3) AS mean_total_ms,
  ROUND((self_time  / NULLIF(calls, 0))::numeric, 3) AS mean_self_ms
FROM pg_stat_user_functions
WHERE schemaname = 'awards'
ORDER BY self_time DESC;
The NULLIF(calls, 0) guard prevents a division-by-zero error for functions that appear in the view with a zero call count — a state that can occur in edge conditions after a partial statistics reset.
For programs that use a formal data dictionary to govern field names and function signatures in their award-import pipeline, maintaining function names aligned with that dictionary makes schema-based identity matching reliable across maintenance cycles. A hall of fame profile data dictionary that standardizes athlete name, team, and award fields also provides the vocabulary that award-import functions operate on — consistency between the data dictionary and function signatures reduces the renaming events that would invalidate an OID-based identity reference.
View Reset and the Missing Stats Reset Column
Unlike pg_stat_statements, which provides a stats_reset column on every row showing when statistics were last reset, pg_stat_user_functions has no stats_reset column. The view does not expose per-function or view-level reset timestamps.
To reset function statistics, call:
SELECT pg_stat_reset();
pg_stat_reset() resets all cumulative statistics counters for the current database — not just function statistics, but also table, index, and sequence statistics. This is a broad action. On a production school athletic database, calling pg_stat_reset() outside an authorized maintenance window discards the existing baseline for all monitored statistics simultaneously.
Because the view provides no reset timestamp, the administration team must maintain an external record of when a measurement window began — specifically, the time at which pg_stat_reset() was called, or the time of the most recent PostgreSQL service restart (which also resets statistics). Without a documented reset time, total_time and self_time values cannot be converted to meaningful per-unit rates because the denominator of the measurement window is unknown.
Practical discipline: Before beginning a function review, record the current timestamp, then call pg_stat_reset() in an authorized staging or test environment. Allow the award-import pipeline to run through a representative cycle. Query pg_stat_user_functions within a defined window — before any maintenance operations or unrelated import runs that would dilute the signal with extraneous function calls. Do not call pg_stat_reset() on a production instance without explicit authorization.
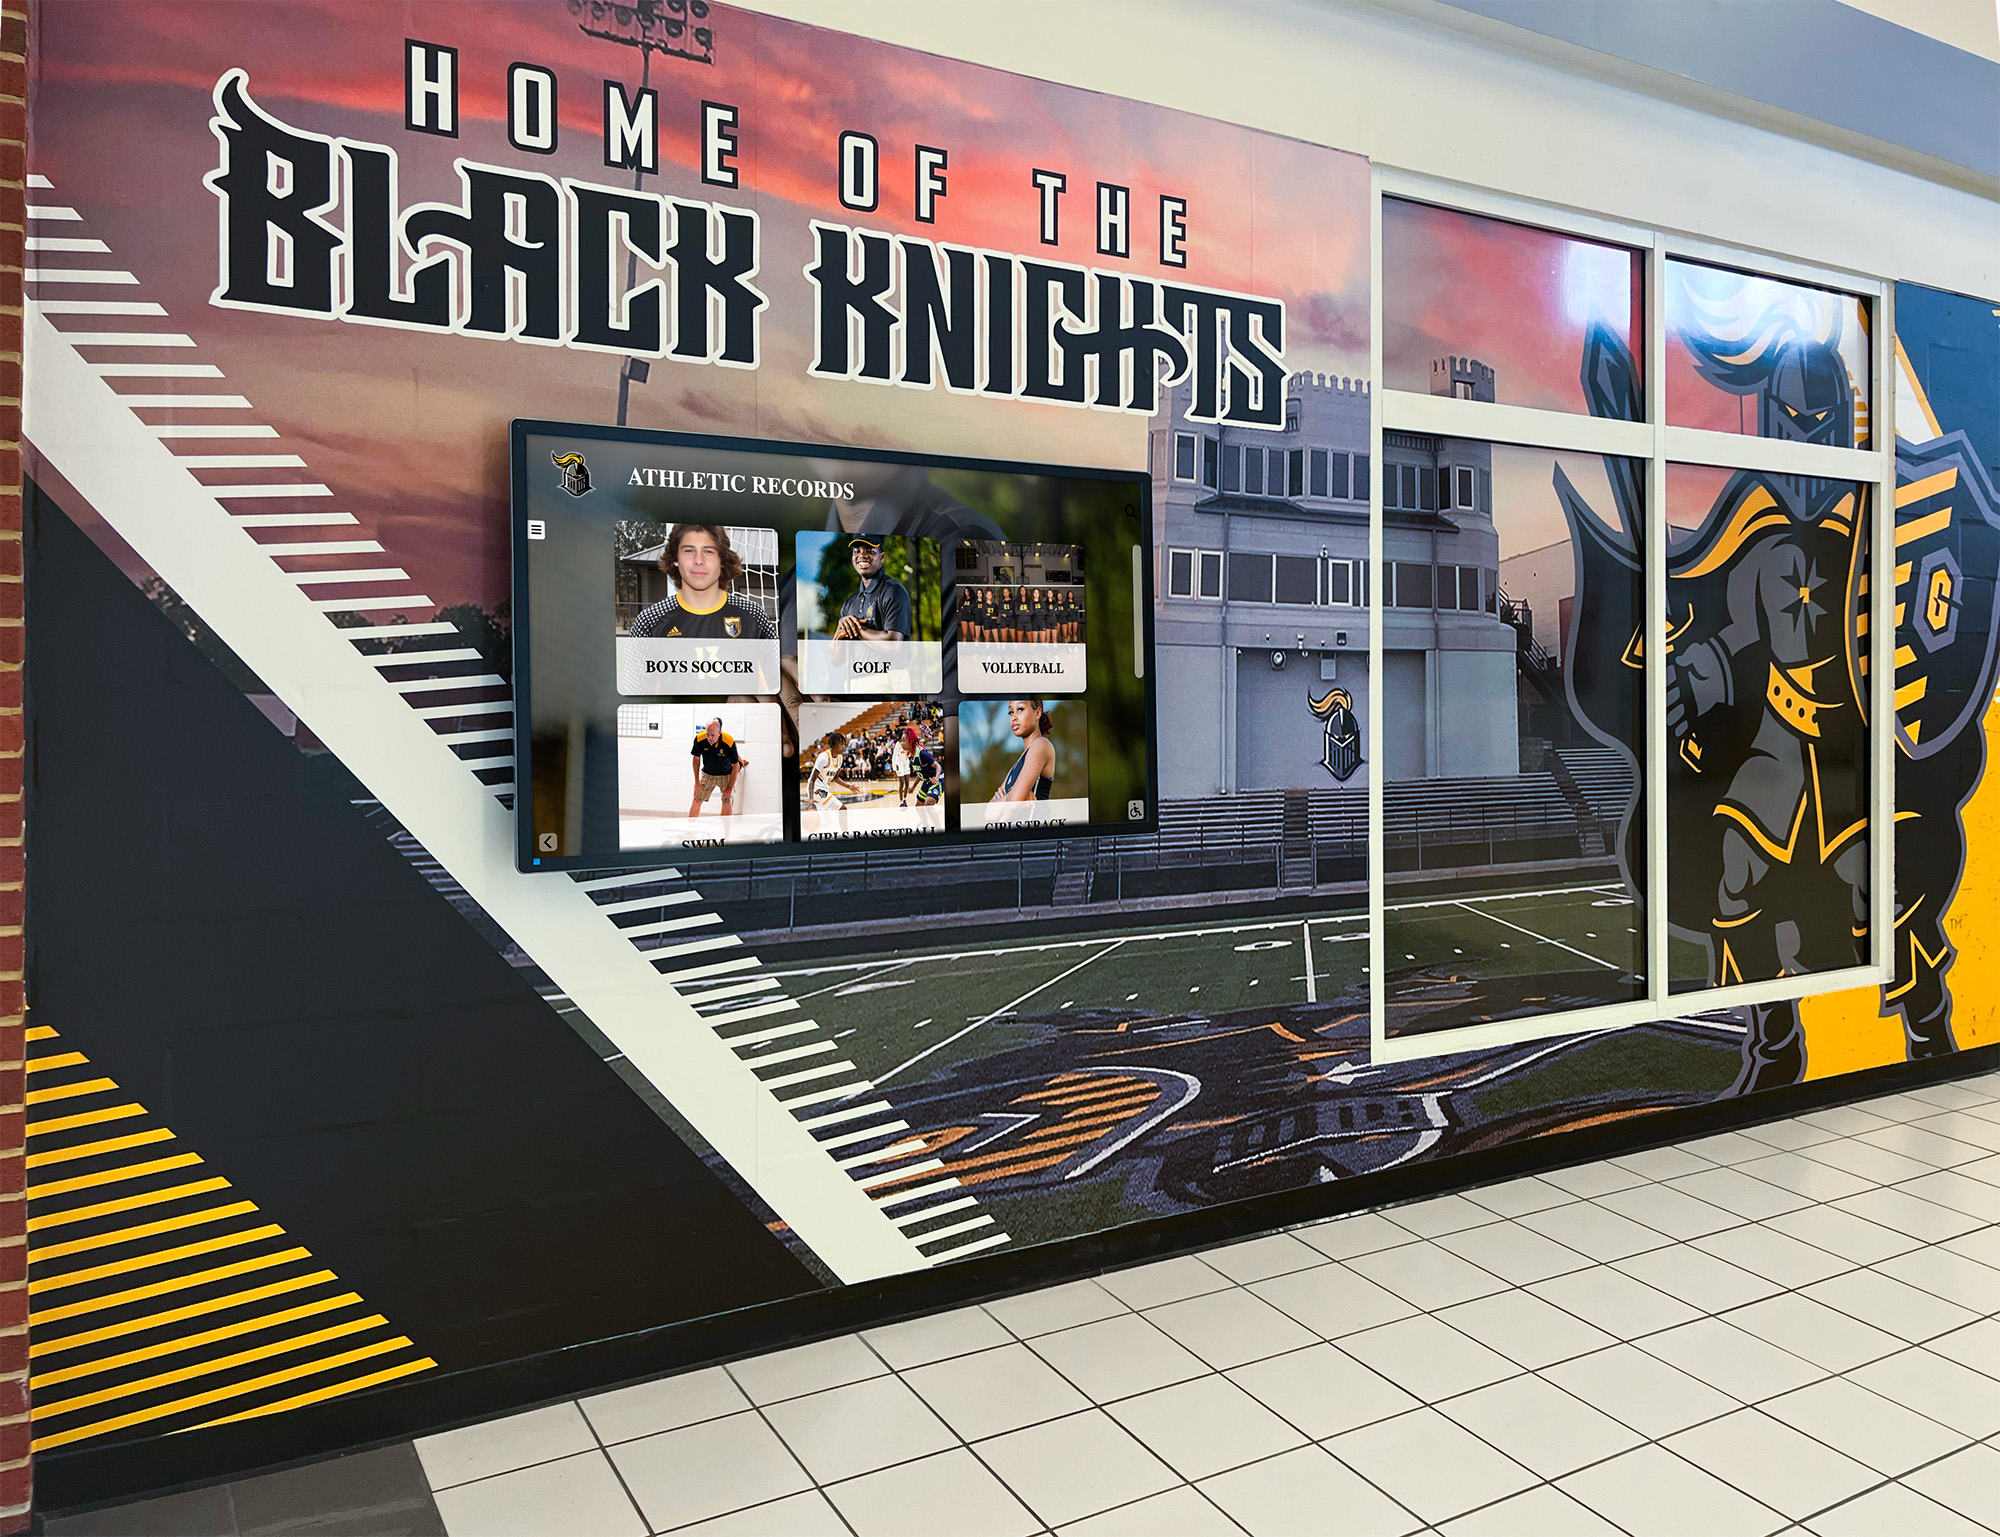
Athletic hall of fame administrators verify that import functions populate recognition records on schedule — pg_stat_user_functions accumulates function execution statistics within a measurement window, but requires external documentation of the reset timestamp because the view itself carries no stats_reset column
Controlled Measurement Windows
A meaningful pg_stat_user_functions review requires a short, documented, single-purpose measurement window. The longer the window and the more varied the workload within it, the harder it is to interpret accumulated statistics.
Window design for an award-import function review:
- Confirm the measurement environment: an authorized staging or test instance running the same schema and PostgreSQL 18 version as production
- Record the window start timestamp externally
- Call
pg_stat_reset()in that environment to establish a clean baseline - Run the import pipeline through a representative batch — the same scale and input shape as a typical end-of-season award import
- Query
pg_stat_user_functionsimmediately after the pipeline completes, before any other significant workload runs - Record the window end timestamp
- Capture the raw values for
calls,total_time, andself_timefor every function in the target schema
With a documented start and end time, the per-call averages (total_time / calls and self_time / calls) can be compared across multiple measurement windows — before and after an optimization to the import function, or between different batch sizes.
Keep snapshots short, not long accumulations. If the measurement window spans several days of mixed workload — regular display queries, ad hoc searches, background maintenance — the calls counter reflects all of that activity, and the per-call averages become a blend of different usage patterns rather than a clean measurement of the import pipeline. Reserve longer accumulation windows for trend monitoring, not for targeted function diagnostics.
For programs that assign stable accession identifiers to athletic archive records as they enter the award database, the import function that generates and assigns those identifiers is often one of the functions worth monitoring in pg_stat_user_functions. A formal athletic archive accession numbering system that specifies how identifiers are constructed and recorded makes the identifier-assignment logic auditable — and self_time measurements can confirm whether that step adds meaningful latency to the import pipeline across representative batch sizes.
Per-Invocation Delta Analysis
The pg_stat_user_functions view accumulates statistics from the moment statistics were last reset. To compare two measurement windows — for example, before and after adding an index on the award table that a reconciliation function queries — capture a snapshot of the view at the end of each window, then compute deltas manually.
Illustrative snapshot and comparison pattern (example relation and column names only):
-- End of Window 1: capture these values externally (e.g., in a log table)
SELECT funcid, funcname, calls AS calls_w1, self_time AS self_time_w1
FROM pg_stat_user_functions
WHERE schemaname = 'awards';

-- Reset, run Window 2 workload, then:
SELECT funcid, funcname, calls AS calls_w2, self_time AS self_time_w2
FROM pg_stat_user_functions
WHERE schemaname = 'awards';

-- Per-invocation mean for each window:
-- mean_self_ms_w1 = self_time_w1 / calls_w1
-- mean_self_ms_w2 = self_time_w2 / calls_w2
The per-call mean (dividing cumulative self_time by calls) is the appropriate comparison metric here. pg_stat_user_functions does not expose percentile distributions — the view provides cumulative totals from which averages can be derived, not the histogram detail needed for percentile analysis. Reporting self_time / calls as a mean and acknowledging that it is a mean — not a median, 95th percentile, or worst-case measurement — is the accurate framing for any review document or IT acceptance note.
For programs that standardize the controlled vocabulary their award data uses — sport names, award category labels, classification tiers — reducing the conditional branching inside import functions often reduces self_time for categorization steps. A controlled vocabulary for athletic archives that standardizes how teams, sports, and award types are named limits the number of normalization branches an import function must evaluate per row. Per-invocation self_time deltas before and after vocabulary standardization can confirm whether that reduction in branching logic translates to a measurable improvement at the function level.
Zero and Absent Rows: What They Do Not Prove
An absent row in pg_stat_user_functions for a given function does not establish that the function ran quickly or efficiently. It may mean:
- The function was not called during the current measurement window
track_functionsis set tonone, or toplwhen the function is a SQL-language or C-language function- The function is a SQL-language function that was inlined into a calling query and is therefore invisible to function-level tracking
- Statistics were reset after the function’s most recent call
A zero self_time for a function that does appear in the view is similarly ambiguous. Very fast functions accumulate sub-millisecond self_time values that may round toward zero at the precision displayed. A zero does not rule out execution — it only confirms that cumulative time across all calls during the window was below the reporting threshold.
The correct interpretation of an absent or zero row is: no evidence of execution within the tracked period at the tracking coverage level configured, or execution time below measurement precision. It is not evidence of fast or correct performance.

Recognition kiosk displays require that import functions execute successfully and within time bounds — verifying this requires confirmed call counts and self_time measurements within a documented window, not the absence of a row from the view
How This Differs from a pg_stat_statements Review
pg_stat_user_functions and pg_stat_statements are complementary but distinct monitoring tools. A school IT review of slow award-import function performance should understand where each tool applies:
| Dimension | pg_stat_user_functions | pg_stat_statements |
|---|---|---|
| Unit of measurement | User-defined function | Normalized SQL statement |
| Self-time isolation | Yes — self_time excludes nested calls | No — total execution time only |
| Inlined SQL function coverage | No — inlined functions are not tracked here | Yes — inlined statement text appears as a standalone row |
| Configuration prerequisite | track_functions ≠ none | Extension enabled in shared_preload_libraries |
| Reset mechanism | pg_stat_reset() (broad; resets all stats) | pg_stat_statements_reset() (targeted) |
| Per-call variability | Cumulative totals only; no standard deviation | mean_exec_time, stddev_exec_time available |
| Stats reset timestamp | Not present in the view | stats_reset column present per row |
If slow execution times surface in pg_stat_statements for SQL statements that live inside a PL/pgSQL function body, the appropriate next step is to use pg_stat_user_functions to confirm which function in the call chain is responsible for the accumulated self_time. The two workflows are sequential: pg_stat_statements identifies slow statements, and pg_stat_user_functions attributes time to the function layer above those statements. Running them with matched measurement windows and documented reset points provides the most complete picture of where an import pipeline’s time is spent.
For programs building out a broader athletic department data infrastructure that includes award imports alongside roster management and schedule tracking, the athletic department management software stack context helps IT administrators understand where the award database function layer fits within the broader application stack — and which other systems may be invoking the import functions that appear in pg_stat_user_functions results.
Why Import Function Performance Matters for Recognition Records
An award-import pipeline that runs slowly has consequences that extend beyond a database administrator’s monitoring dashboard. Athletic records that should appear on a recognition display before a hall of fame induction night may be delayed if import functions exceed their scheduled window. A data-reconciliation function that takes unexpectedly long can hold table-level locks that increase latency for concurrent display queries — the same queries serving kiosk users browsing inductee profiles during an event.
These operational delays affect the athlete stories that recognition programs exist to tell. A first-team all-conference designation that should appear on a hallway kiosk before a senior athlete’s last home game matters to that athlete and to the families and classmates who will look up the record during the event. An import function review is the technical mechanism that confirms those records arrive on time.
For school programs planning the long-term retention of award records — including the records that import functions write into the award table — athletic award records retention planning provides guidance on how long different categories of records should be kept and in what formats. That retention scope directly affects the volume of data that award-import functions process each season and how that volume compounds over time.

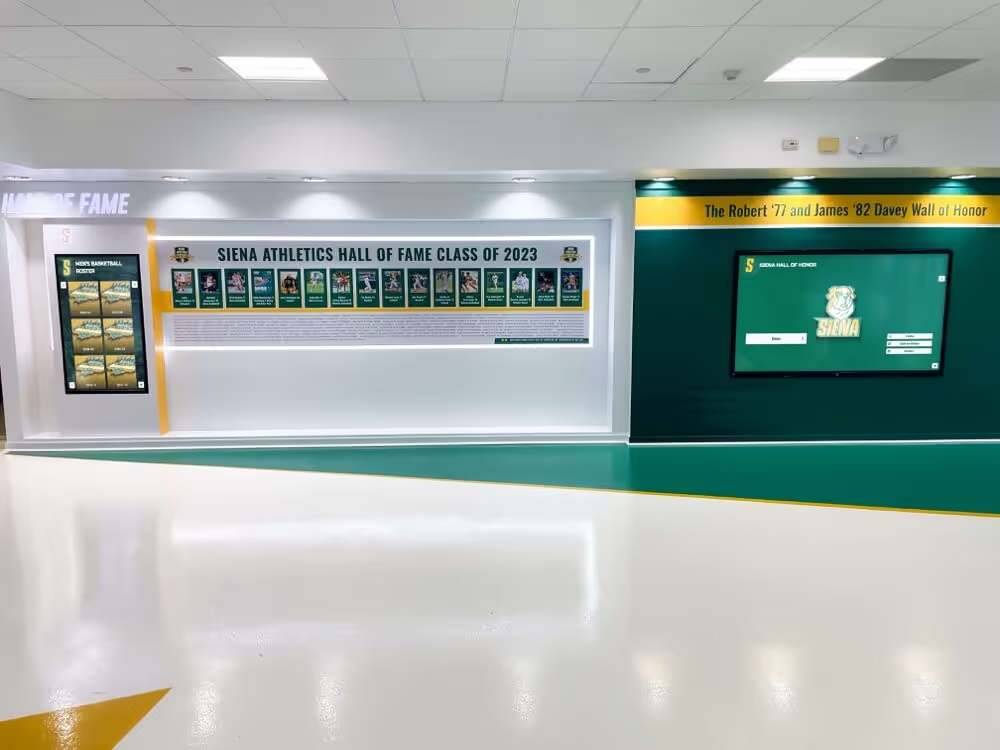
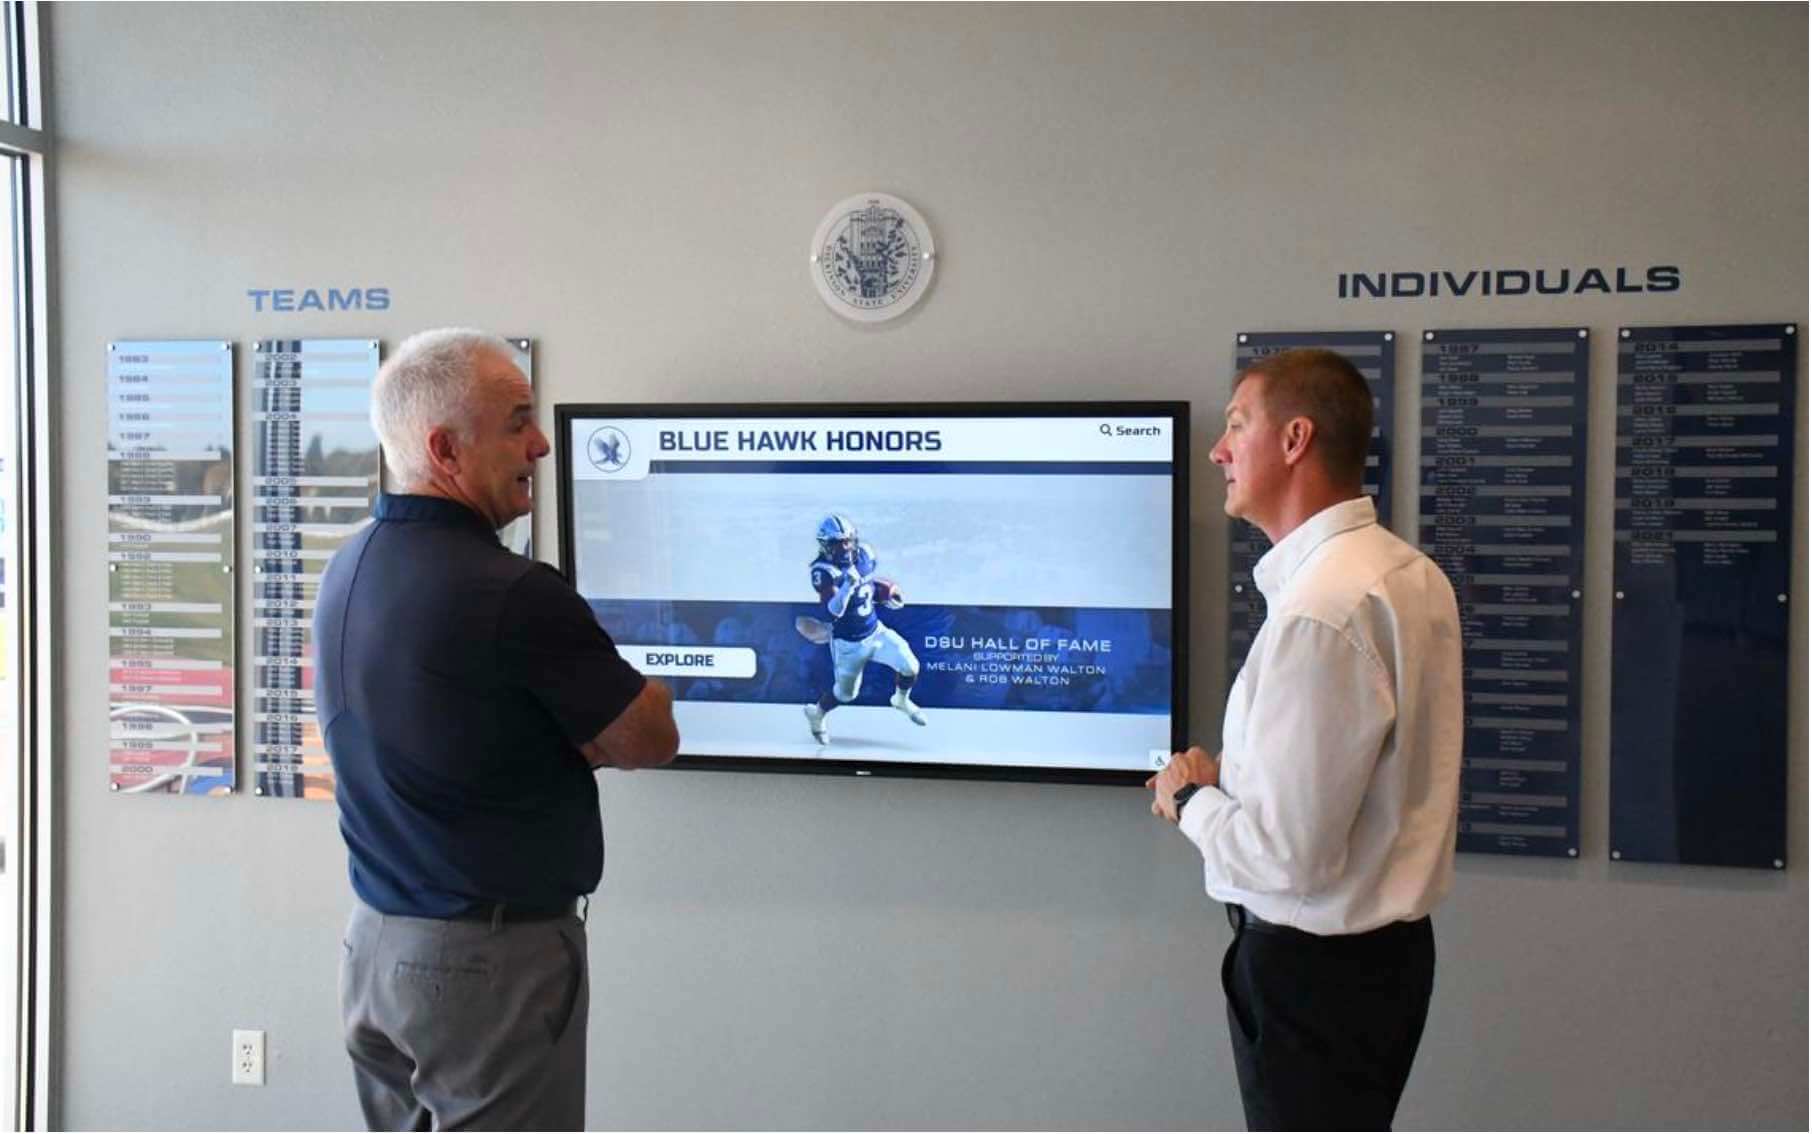
Every athlete portrait on a hall of fame touchscreen depends on import functions having run successfully and within acceptable time windows — pg_stat_user_functions provides the measurement surface that attributes import execution time to specific functions in the pipeline, separately from the display-path queries pg_stat_statements monitors
Frequently Asked Questions
What is the difference between total_time and self_time in pg_stat_user_functions?
total_time records the cumulative elapsed time for all calls to a function, including all time spent inside every other function that function calls. self_time records only the time the function spent on its own instructions, after subtracting the time attributed to any nested function calls. Summing total_time across all functions in a nested chain double-counts the time spent in inner functions. Reading self_time for each function gives an accurate breakdown of where execution time genuinely accumulates.
Why might a function not appear in pg_stat_user_functions even with track_functions = all?
A SQL-language function that is simple enough to be inlined into the calling query by the PostgreSQL planner will not appear in pg_stat_user_functions regardless of the track_functions setting. When a function is inlined, its body is substituted directly into the execution plan, eliminating the function call boundary that statistics collection requires. Additionally, if track_functions is set to pl, only procedural-language functions appear — SQL and C functions require track_functions = all.
How do I reset pg_stat_user_functions statistics for a clean measurement window?
Call SELECT pg_stat_reset(); to reset all cumulative statistics for the current database, including function statistics. Unlike pg_stat_statements, there is no per-view reset function. The view also carries no stats_reset column, so the reset timestamp must be recorded externally. Do not call pg_stat_reset() on a production instance outside an authorized maintenance window.
What does an absent row in pg_stat_user_functions mean for a function that should have run?
An absent row does not establish that the function ran quickly or correctly. It may mean the function was not called during the measurement window, that track_functions does not cover the function’s language type, that a SQL-language function was inlined, or that statistics were reset after the last call. Confirm the active track_functions setting, verify the function was actually invoked, and document the reset timestamp before drawing conclusions from an absent row.
How does a pg_stat_user_functions review differ from a pg_stat_statements slow-query review?
pg_stat_statements identifies which SQL statements are slow, exposing per-statement mean and standard deviation metrics alongside a stats_reset column. pg_stat_user_functions identifies which functions in the call chain own the accumulated time, attributing self_time to each function’s own instructions separately from nested calls. The two workflows are sequential and complementary — not interchangeable — and slow SQL query review via pg_stat_statements is a separate workflow from function self-time attribution via pg_stat_user_functions.
Conclusion: Reading self_time to Locate Where Import Time Accumulates
An athletic awards database pg_stat_user_functions review gives school IT administrators a function-level view of where import and reconciliation pipelines spend time — a measurement surface that pg_stat_statements alone or application-layer logging cannot fully substitute for. The central analytical discipline is reading self_time rather than total_time when working with nested function call chains, and avoiding the double-counting that results from summing total_time across a call stack. The practical prerequisites are straightforward on a self-managed PostgreSQL 18 instance: set track_functions to pl or all based on the function languages in use, document that the view carries no stats_reset column so that resets must be tracked externally, use schema-plus-name identity to match functions reliably across measurement windows, and treat absent or zero rows as inconclusive rather than as performance confirmation.
These disciplines make pg_stat_user_functions a reliable part of a seasonal recognition database review cycle — aligned with the import windows that precede induction nights, athletic banquets, and championship recognition ceremonies where the records populated by those functions will be visible to athletes, families, and the wider school community.
See How Rocket Alumni Solutions Manages Award Record Imports for Your School
Rocket Alumni Solutions provides school athletic departments with a cloud-based recognition platform where award record management, import workflows, and display publication are handled at the platform level — so induction nights, athletic banquets, and championship celebrations load accurate, complete athlete records without your IT team managing PostgreSQL function tracking, import pipeline diagnostics, or measurement window documentation. Request a demo to see how the platform delivers reliable award record management for programs of every size.